


Are Foreigners Selling US Assets?
A brief guide to tracking capital flows

Introduction (by Jens Nordvig): The Capital Flow Mosaic
Economic data is easy to track. A lot of investors use the ECO function on the Bloomberg to get new information, and compare to consensus. Everybody looks at the same information, drawing mostly on official statistics at the country level.
But capital flow data is harder to come by, and often overlooked and under-analyzed.

I have personally worked with capital flow data for a long time.
It was a core part of the infrastructure for currency analysis at Goldman Sachs when I joined there in 2001 (some may be familiar with concepts such as the Broad Basic Balance from then), which was initially developed by Jim O’Neill (the inventor of the BRICS concept), and used when I took over currency analysis.
Capital flow analysis also a core part of the framework at Bridgewater Associates, or at least it was when I was hired by Ray Dalio and his team in the middle of the global financial crisis.
Since 2016, when we launched Exante Data, capital flow analysis has also been central to what we do, and it becomes absolutely essential in times of upheaval, when capital suddenly starts to move unusually through global capital markets.
This was the case in 2016, for example, when China was facing severe capital outflow, and had to conduct large-scale intervention to stop the CNY from depreciating too fast.
And this has been the case in 2025, when the accumulation of policy shocks in the US has made foreign (and US!) investors concerned about the attractiveness and safety of US assets.
The key is to piece together a mosaic from the various pieces of whatever information you can get, from different countries and different sources, at both the macro level and the micro level—to get to the truth about what flows are actually driving the price action.
What is happening with asset allocation to US assets and the USD? (Alex Etra & Jens Nordvig)
Let us start with the easy part.
Instruments that are traded on a centralized exchange are relatively easy to track. Hence, we can get a full picture of activity in ETF space simply by aggregating flow and positioning information from this source.
But ironically, the US ETF universe (zooming in on fixed income ETFs) is so dominated by US (or USD) focused instruments, that there is barely any foreign exposure to track (to look for a sign of a shift out of US assets).
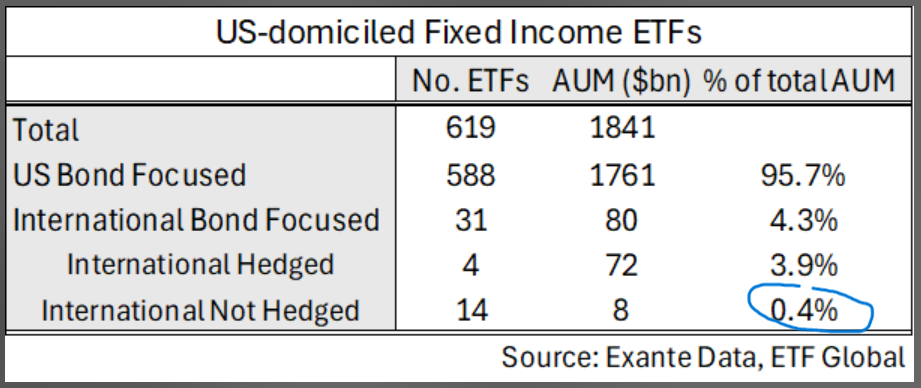
Nevertheless, we can combine our tracking with US related ETF and mutual fund flows with the equivalent tracking in Europe, to get a sense of a regime shift.
The chart below, in daily space, illustrate that the turmoil in the US bond market has been fairly US specific. We have not had any similar selling of European bonds. That said, most of the fund flow is from domestic investors.
Then there is official data. Foreign holdings of US fixed income (as a share of outstanding) is indeed elevated but is actually lower than at just about any point since the GFC (even after adjusting for the Fed’s holdings).

But what really matters in the current environment is the allocation to US fixed income in foreign fixed income portfolios and in US investor portfolios. As shown above in the ETF space and below in aggregate, there is incredible ‘home bias’ in US investors’ fixed income portfolios—much less than in the case of European and Japanese investors for instance.

While European and Japanese investors allocations to foreign debt securities comprise roughly 30% and 20% of their total fixed income holdings, in the US case it is under 10%. In the case of Japanese and Eurozone investors, allocations specifically to US fixed income comprise roughly 60% of their foreign fixed income holdings and about 15% of their total fixed income portfolios. Among European investors in particular their US allocation has roughly doubled over the last decade.
By contrast, in the case of the US investors, allocations to Euro Are fixed income comprise about 25% of their foreign bond holdings but just 1.6% of their total fixed income portfolio.
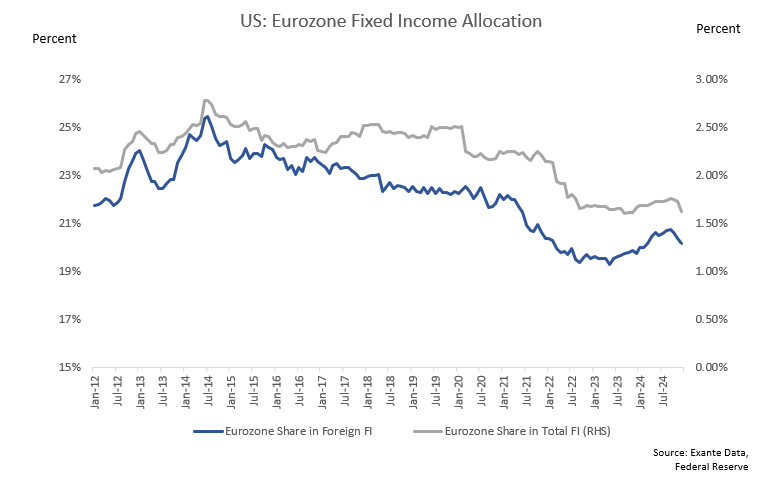
This logically implies that tension in bond markets have more potential to spook international investors when it involves the US market, simply because exposures are so elevated—given domestic investors have traditionally been found to be stickier during periods of turmoil.
Tentative Signs of Japanese Selling
Tracking the behaviour of Japanese institutional and retail investors remains incredibly important both for the Yen and for global fixed income markets. As we have written about previously (link, link) Japanese investors have been major buyers of global fixed income so any signs of repatriation may be a key signal. While it is still a bit too soon to conclude definitively, there are signs that Japanese investors have been selling global (in large part) US fixed income in recent weeks.
(Note, this chart below uses balance of payments definitions, so a positive figure means repatriation back to Japan, and selling of foreign fixed income, like US Treasuries).
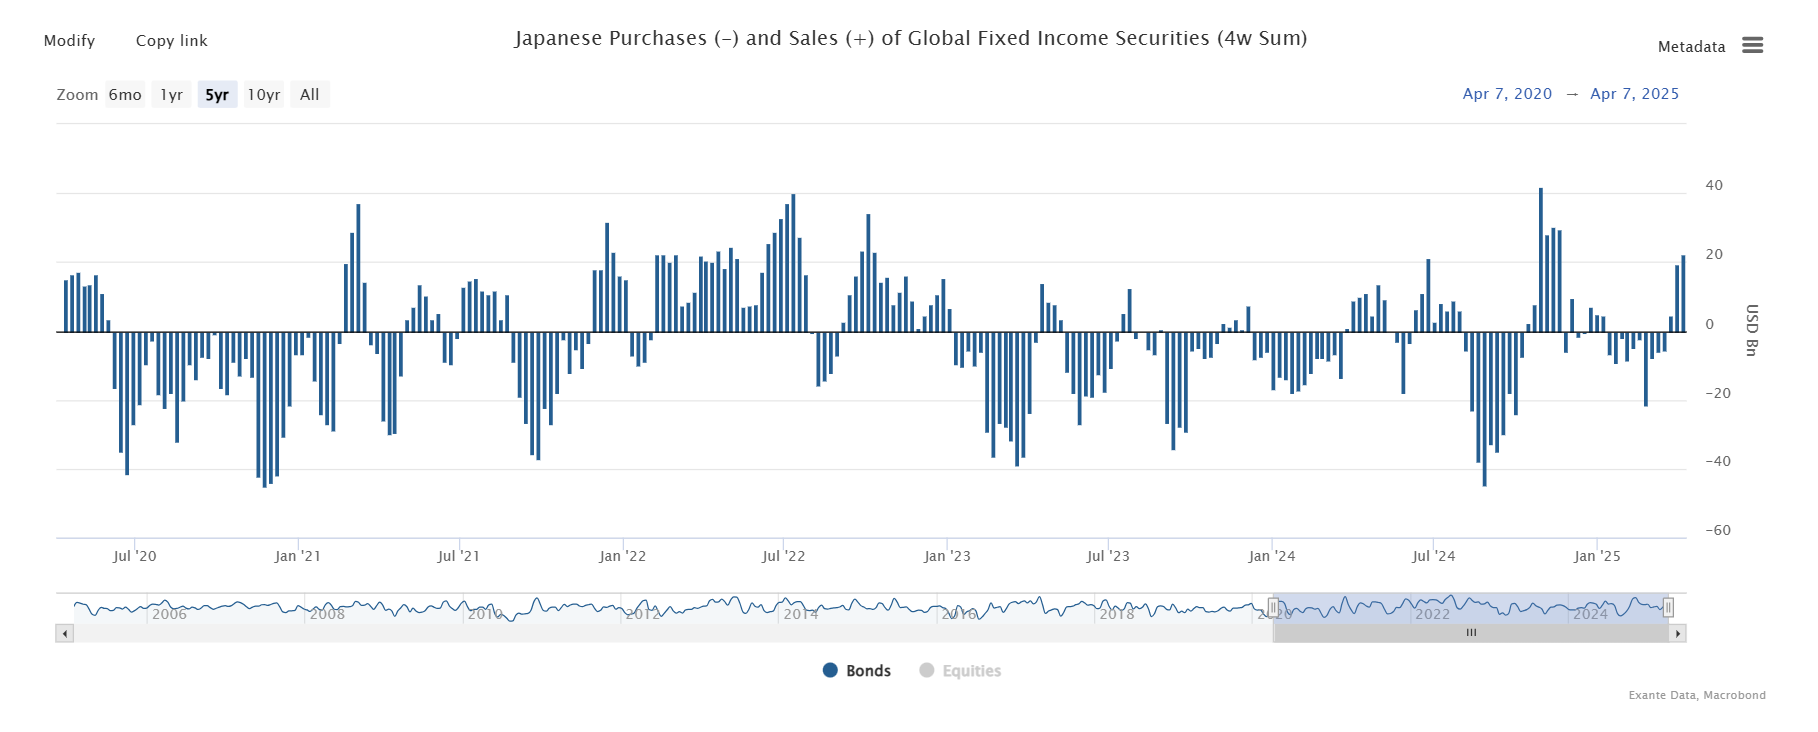
While not yet quite as large as the selling observed in the run up to the US election, we have to continue to watch these flows to see if the selling becomes persistent (as it was in 2022). But even without outright selling, and even before the latest tariff-induced financial volatility, there were signs that Japanese investors appetite for global fixed income was starting to dwindle. After rising by $100bn per year for the last two decades, Japanese flows to global fixed income have been basically flat for the last +2yrs on net.

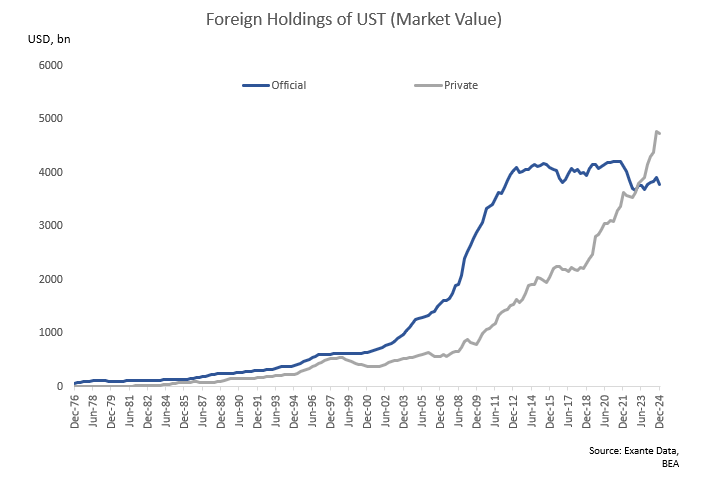
Limited Signs of Official Sector Sales
Whenever Treasury yields rise we inevitably get asked whether it could be driven by foreign central bank reserve managers—particularly China—selling. There is of course room for healthy debate about causality here, but in our view the traditional relationship runs from rising US interest rates through a stronger dollar to reserve manager FX selling to defend their currencies from depreciation pressure (rather than via reserve manager selling UST pushing up interest rates and then selling USD to weaken the dollar).
Maybe ‘this time is different’, and reserve managers are reducing their USD allocation without actually selling FX reserves, but the data we do have doesn’t suggest and outsized role for foreign official investors in the latest UST selloff. China, for instance, does not appear to have been intervening heavily in March and weekly data on foreign official holdings of UST and deposits at the Federal Reserve through last Wednesday do not point to aggressive UST selling.
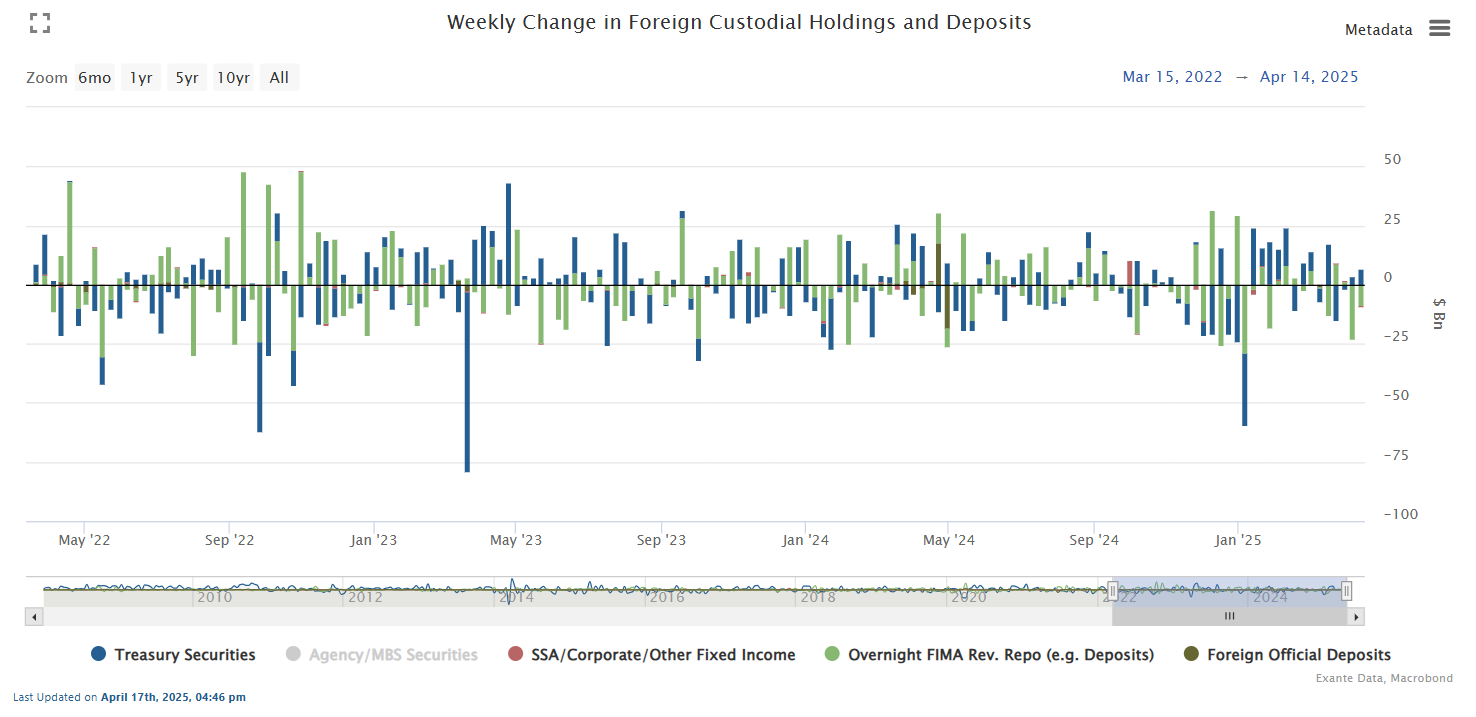
Time will tell of course, but based on the data we have now it looks like sales by private investors have been a more important driver recently. Indeed it is worth noting that foreign private holdings are now larger than foreign official holdings of UST (though admittedly there has also been a trend towards reserve managers outsourcing to private asset managers which cannot be captured in this data).
What about FX hedging?
Further complicating the analysis of cross-border flows is currency hedging. Trillions of cross-border exposures are FX hedged, mostly via FX forwards.
And since the FX market is generally more liquid than the underlying securities holdings, the initial position adjustments actually often happens in FX.
We have our own proprietary collection of hedge positions, but it is challenging to get very timely data in this space. But the feedback we get from CIOs in our network, including from some of the world’s largest asset managers, is clear: FX adjustments tend to happen quicker than adjustments in the underlying securities.
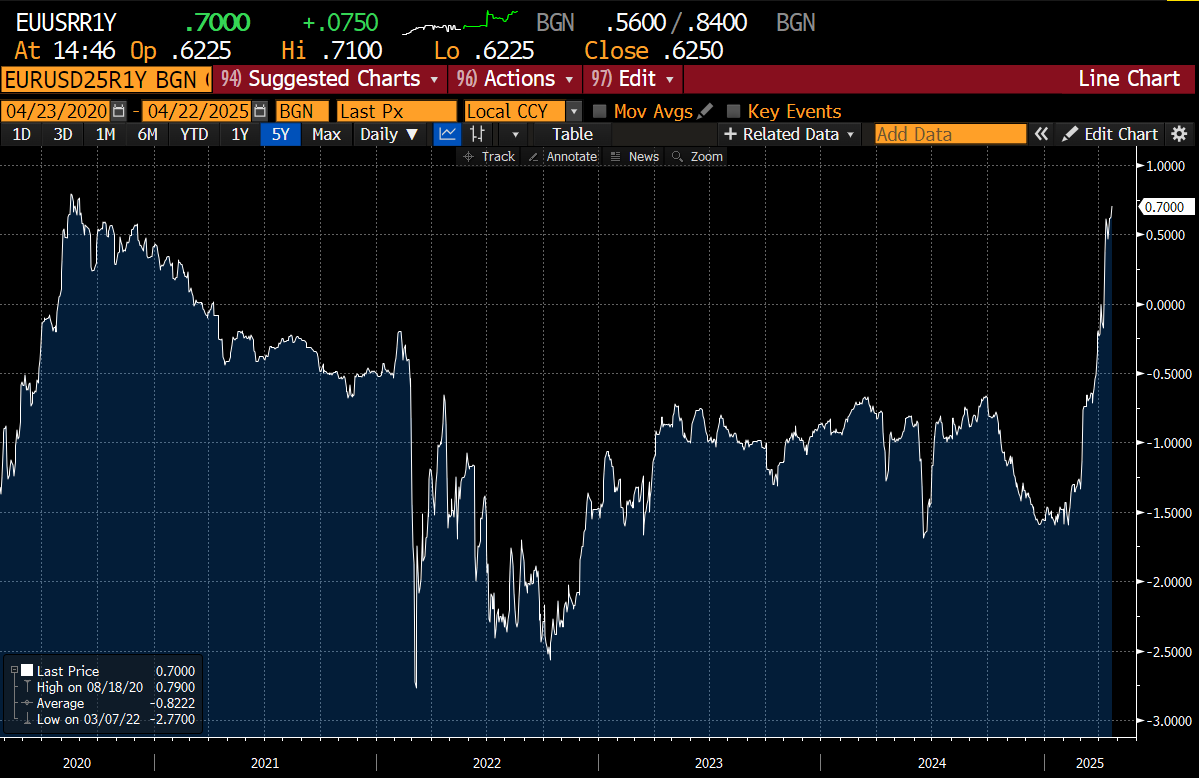
Here, we illustrate with showing the 1-year risk reversal for EURUSD (which is the difference in option pricing for EUR calls vs EUR puts, expressed in vols, for 1-year options.)
Clearly we have seen a major major shift in March and April, with investors paying up for EUR calls (USD puts) in a way we have not seen for years (the COVID shock was the last time). We cannot say for sure whether this is hedging activity or speculative trading. It is often a combination, and it is dramatic departure from the trends seen in recent years.
The Mosaic of Flows
Capital flow tracking involves piecing together a mosaic of information. Macro flow data; micro flow data; price signals; option indicators; structural positioning information; hedge information; forward looking anecdotes.
From this mosaic we conclude that a structural shift in asset allocations is in motion.
We are not talking about a TACTICAL shift lasting a few days or a few weeks. We are talking about a unique STRATEGIC shift, caused by an accumulation of policy shocks emanating from US policy makers.
Investors around the world are now searching for alternative reserve currencies.
This does not mean that the US Dollar will lose its reserve currency in a binary way. There is no candidate to replace the dollar. But it does mean that a long list of different types of investors will be looking to reduce USD exposure if they can find a way to do so. And this is a very new situation compared to the trend since 2014, when the Dollar was generally appreciating, and investors were mostly content with assuming more and more USD exposure.
The content in this piece is partly based on proprietary analysis that Exante Data does for institutional clients as part of its full macro strategy and flow analytics services. The content offered here differs significantly from Exante Data’s full service and is less technical as it aims to provide a more medium-term policy relevant perspective. The opinions and analytics expressed in this piece are those of the author alone and may not be those of Exante Data Inc. or Exante Advisors LLC. The content of this piece and the opinions expressed herein are independent of any work Exante Data Inc. or Exante Advisors LLC does and communicates to its clients.
Exante Advisors, LLC & Exante Data, Inc. Disclaimer
Exante Data delivers proprietary data and innovative analytics to investors globally. The vision of exante data is to improve markets strategy via new technologies. We provide reasoned answers to the most difficult markets questions, before the consensus.
This communication is provided for your informational purposes only. In making any investment decision, you must rely on your own examination of the securities and the terms of the offering. The contents of this communication does not constitute legal, tax, investment or other advice, or a recommendation to purchase or sell any particular security. Exante Advisors, LLC, Exante Data, Inc. and their affiliates (together, "Exante") do not warrant that information provided herein is correct, accurate, timely, error-free, or otherwise reliable. EXANTE HEREBY DISCLAIMS ANY WARRANTIES, EXPRESS OR IMPLIED.
There is no one point of data in this article beside options that point in the direction of opinion at the end. What am i missing? Foreigners don't seem to be selling ust, domestic investor are mostly stable regardless of the situation but in recend month they seem to drive the sell off (this does not confirm narrative that world is dumping US). Also we can't really exctrapolate trend only bcs we know that someone is selling (which we don't know). If i am wrong please correct me.
Really sharp breakdown. Love how you’re framing this not as a rotation out of the U.S., but a quiet re-pricing of global moats.
Feels like the next cycle will reward resilient, boring excellence over narrative-driven hype.