China's BoP at end-2024
FDI outflows likely driven by multinationals shifting panda bond proceeds offshore; goods trade data mystery shifts
RMB is facing depreciation pressure from low domestic interest rates and uncertainty regarding the outlook for trade policy, though authorities have contained realized depreciation. At the same time, China’s balance of payments (BoP) remains the key determinant for RMB across quarters and years.
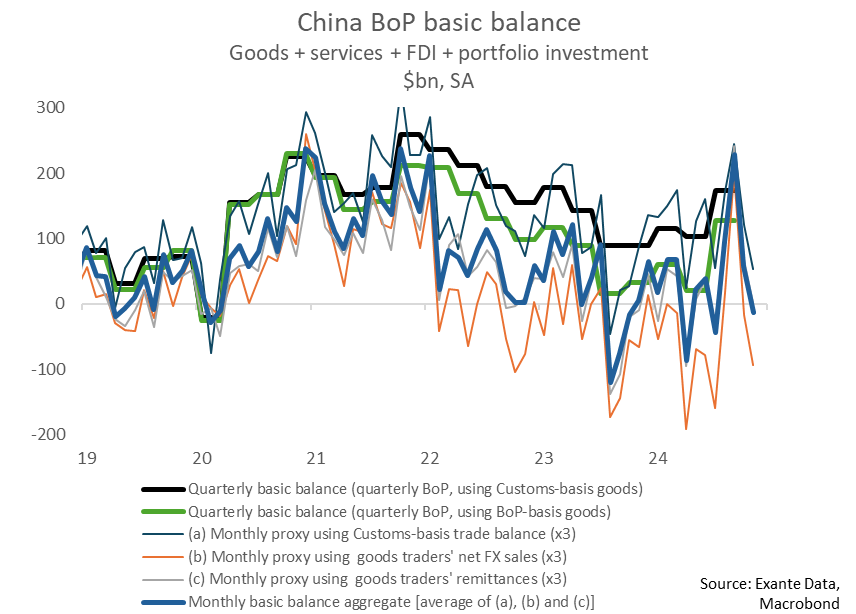
China's basic balance weakened from $19bn in October to -$4.4bn in November. The decline was mostly the result of a sharp fall in net FDI flows, likely a result of regulatory loosening of how easy it is for foreign companies to bring CNY bond proceeds offshore. At the same time, portfolio flows were stable (if deeply negative), and suggests that Trump's win wasn't the only reason behind the deterioration in the basic balance. The current account was stable, and exporters' FX conversion rate remained relatively high.
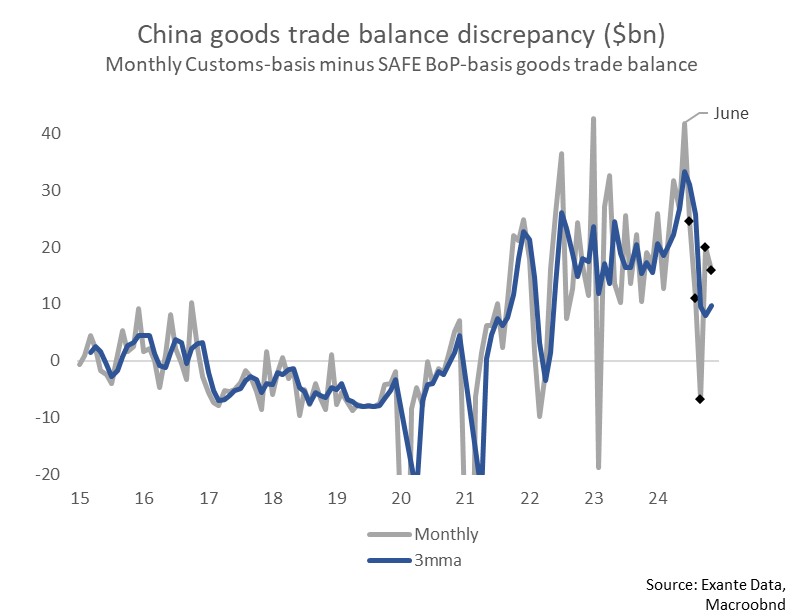
We have also been tracking the true size of China's goods trade balance (Customs Administration's data suggests that the trade balance is larger than what is reported by SAFE). The discrepancy has fallen sharply in recent months, from $85bn in Q2 to $28bn in Q3 (the discrepancy even turned negative in September). Up until a few months ago, the gap was mostly the result of differences in the reported size of exports - but recently, around two-thirds of the discrepancy was due to imports. We will look more into this topic, though we will here simply conclude that the phenomenon appears to be shifting.
Despite the headwinds from US-China trade tensions and renewed BoP weakness, Chinese exporters have continued to convert a large share of dollar earnings into renminbi—and this could well continue to provide a persistent and large source of renminbi demand.
China's basic balance—the sum of the goods and service balance plus net FDI and portfolio investment flows—jumped very sharply in September, but turned more neutral in October and negative in November. This broadly takes China's basic balance back to the middle of the range observed during 2023-2024: weak but not catastrophic. We do not think there are reasons to expect that there was a large improvement in December so that BoP trends will (or already have) prompt(ed) FX sales by authorities again before long.
When looking at China's basic balance, we like to look at three different measures, each of which differ in how they count the goods trade balance: the trade balance, inbound cross-border transfers by goods traders and FX sales by goods traders. Each metric emphasizes different aspects of China's basic balance, so we like to average the three metrics.
In August we argued that dollar weakness would prompt Chinese goods traders to convert a larger share of their FX earnings into renminbi, and this has played out forcefully (link). At the time we thought that shifts in goods traders' FX conversion rates have historically tended to play out over multi-quarter periods.
After Trump won the US election in November, we expected goods traders would become more hesitant to convert dollars into renminbi. While goods traders' FX conversion rates have indeed fallen a bit since peaking in September, they still remain rather high. As Chinese goods exporters are major buyers of renminbi, a persistently high FX conversion rate could provide a source of support for the currency amid more volatile portfolio flows. One explanation for the high conversion rate is that goods traders are being prompted by regulators to bring back overseas earnings, though we don't have any evidence to support this idea.
Below we discuss three interesting takeaways from the recent/Q3 BoP data:
1) FDI outflows resume, pickup in FDI-related debt outflows could be behind
Cross-border transfers for FDI have been a major contributor to volatility in our monthly measure of China's basic balance, and November was no different. China's net inbound FDI had improved gradually from -$16bn in July to -$4bn in October, though there was a sharp reversal to -$23bn in November.
To get a better sense of FDI trends, we will start tracking inbound and outbound FDI data published by the Ministry of Commerce. We are still getting familiar with the dataset but think this data is more likely to reflect "true" FDI, such as greenfield investments and M&A, compared to the cross-border transfers data, which might be more distorted by "financial" transactions such as dividend payments, intra-company lending etc.
The new measure of net inbound FDI only declined marginally in November and could suggest that the decline in FDI-related cross-border transfers might have been driven by financial transactions. (We show a breakdown of the grey line in the appendix).
The official quarterly data on Chinese inbound and outbound FDI is not very detailed, though looking at what has driven changes up to Q3 can give us a general sense of what trends were underway up to that point, and therefore might have continued into Q4. The major driver of the improvement in FDI flows in Q3 was that outbound debt flows narrowed sharply, from -$31bn in Q2 (4qma: -$21bn) to just -$0.2bn, the smallest amount of outflows via FDI debt since 2017. If FDI debt had remained simply returned to its 4qma, net FDI would have been -$64bn instead of the actual -$34bn (see below chart).
One possible explanation for the FDI outflows relate to foreign companies' local CNY bond issuance (panda bonds). Prior to early 2023, only sovereign issuers could bring panda bond proceeds offshore, though this started to change in early 2023, when foreign corporates were also allowed to bring panda bond proceeds offshore. This provided a highly attractive way for foreign firms to fund their global operations by issuing low-interest bonds in China.
Anecdotally, we have learned that there was a crackdown on foreign firms bringing the proceeds from panda bonds offshore in early-mid October, and it seems likely that this could be behind the sudden shift in FDI debt outflows in Q3 (even if a few months early). On a technical note, "Loans, deposits, and similar transactions between enterprises in a direct investment relationship are generally recorded as direct, rather than other, investment" (link).
Outflows via FDI-related debt started to widen substantially in Q3-2022 (see below chart). Perhaps the policy loosened earlier than what anecdotes indicate (early 2023), or perhaps this was simply disguised capital flight happening at the depths of zero COVID lockdowns. The large narrowing of outflows (Q3-24) also happened a bit earlier than when anecdotes suggest the outflows were restricted (mid to early October 2024); perhaps the de facto policy tightening happened a bit earlier.
On December 18th, the PBOC made a brief announcement (link in Chinese) that seemingly loosens restrictions on foreign firms' ability to use panda bonds for offshore expenses, however. The key sentence in the announcement is to "allow multinational companies' domestic member enterprises to engage in cross-currency borrowing for current account cross-border payment business, reducing corporate capital financing costs". According to a local source, the initial restriction on bringing panda bond proceeds offshore was never formalized; the investment banks organizing bond issuances were simply told by authorities in an informal manner. Though speculative, perhaps the December 18th announcement was simply the formalization of a policy loosening that took place in November (which would explain the increase in FDI-related outflows in November).
As such, it is possible that the increase in FDI-related outflows during November has been driven by multinational firms bringing panda bond proceeds offshore once again. The monthly data on cross-border transfers doesn't contradict this point; outbound transfers related to FDI rose from $57bn in October to $71bn whereas inbound transfers were stable ($55bn in October to $54bn in November).
2) Goods trade data discrepancy falls but remains and shifts from exports to imports
In the past few years, we (and many others) have found it difficult to make sense of the large discrepancy between the data on China's goods trade balance published by the Customs Bureau (larger goods trade balance) and SAFE (smaller goods trade balance).
In Q3, however, the discrepancy fell sharply, from $85bn in Q2 to $28bn, and even turned negative during September (-$7bn), though it has since rebounded. We use the monthly goods trade data reported in the below chart; this data is practically identical to the quarterly BoP goods trade data.
The discrepancy used to be driven by exports, though that has also changed in the past few months. In November, Customs-basis exports were $6bn above that reported by SAFE (on a BoP basis), whereas the number was -$13bn for imports. As such, the discrepancy is now more so driven by imports than exports, whereas the opposite was the case until a few months ago. We will look more into this topic, though we will here simply conclude that the phenomenon appears to be shifting.
3) Net other investment sees large decline, but more technicality than actual outflow
There has been a very large increase in outflows from China via the "other investment" category: from an inflow of +$2bn in Q2 to an outflow of -$113bn in Q3. This category "includes all financial transactions not considered direct investment, portfolio investment, or reserve assets" (link) and is sometimes viewed as a channel for capital flight (as well legitimate transactions) in China.
The main driver of decline was currencies and deposit assets (+$34bn to -$30bn), where a negative number indicates that Chinese entities are increasing their holdings of FX deposits and currencies, even if the money is held domestically. As such, an "outflow" via currencies and deposits doesn't necessarily reflect BoP pressure in the sense that it puts pressure on the renminbi - it is likely in large part an "offsetting transaction" for large (FX) inflows.
One likely explanation is that there was a large increase in inbound FX transfers to China during Q3 (see below chart), and that the offsetting transaction for the inflows was an increase in FX deposits, which is counted as an “outflow”. (We don't know the composition of the FX flows by category, only the categorical composition of FX+RMB inflows). As such, it doesn't look like the "outflows" observed under net other investment were capital flight in Q3.
The content in this piece is partly based on proprietary analysis that Exante Data does for institutional clients as part of its full macro strategy and flow analytics services. The content offered here differs significantly from Exante Data’s full service and is less technical as it aims to provide a more medium-term policy relevant perspective. The opinions and analytics expressed in this piece are those of the author alone and may not be those of Exante Data Inc. or Exante Advisors LLC. The content of this piece and the opinions expressed herein are independent of any work Exante Data Inc. or Exante Advisors LLC does and communicates to its clients.
Exante Advisors, LLC & Exante Data, Inc. Disclaimer
Exante Data delivers proprietary data and innovative analytics to investors globally. The vision of exante data is to improve markets strategy via new technologies. We provide reasoned answers to the most difficult markets questions, before the consensus.
This communication is provided for your informational purposes only. In making any investment decision, you must rely on your own examination of the securities and the terms of the offering. The contents of this communication does not constitute legal, tax, investment or other advice, or a recommendation to purchase or sell any particular security. Exante Advisors, LLC, Exante Data, Inc. and their affiliates (together, "Exante") do not warrant that information provided herein is correct, accurate, timely, error-free, or otherwise reliable. EXANTE HEREBY DISCLAIMS ANY WARRANTIES, EXPRESS OR IMPLIED.


