


Chinese banks net foreign assets jump sharply
But it might more so reflect a shift of FX funding from offshore to onshore than a "real" increase in net foreign assets

Chinese banks’ net foreign assets (NFA) jumped sharply in December, and some have found this surprising as there is evidence that state banks supported the renminbi by selling foreign exchange last month.
In this brief note we look at what might have driven the increase in banks’ NFA, focusing on the liability side. One explanation is that Chinese banks have likely started to source more of their FX funding within mainland China (“onshore”) rather than outside of the country (“offshore”). Seasonality, a more mundane explanation, also makes the December jump seem less extreme.
This means that the increase in Chinese banks’ NFA perhaps might be slightly less reflective of a “real” increase in their total (offshore and onshore) net FX holdings than the headline NFA data would suggest. As such, the latest NFA data might therefore not contradict the notion that state banks have sold FX to defend the renminbi as it would appear at a first glance.
To start with a definition: banks’ net foreign assets is calculated as foreign assets minus foreign liabilities. “Foreign” means against non-residents (i.e. entities incorporated outside of mainland China) and includes both renminbi as well as other currencies.
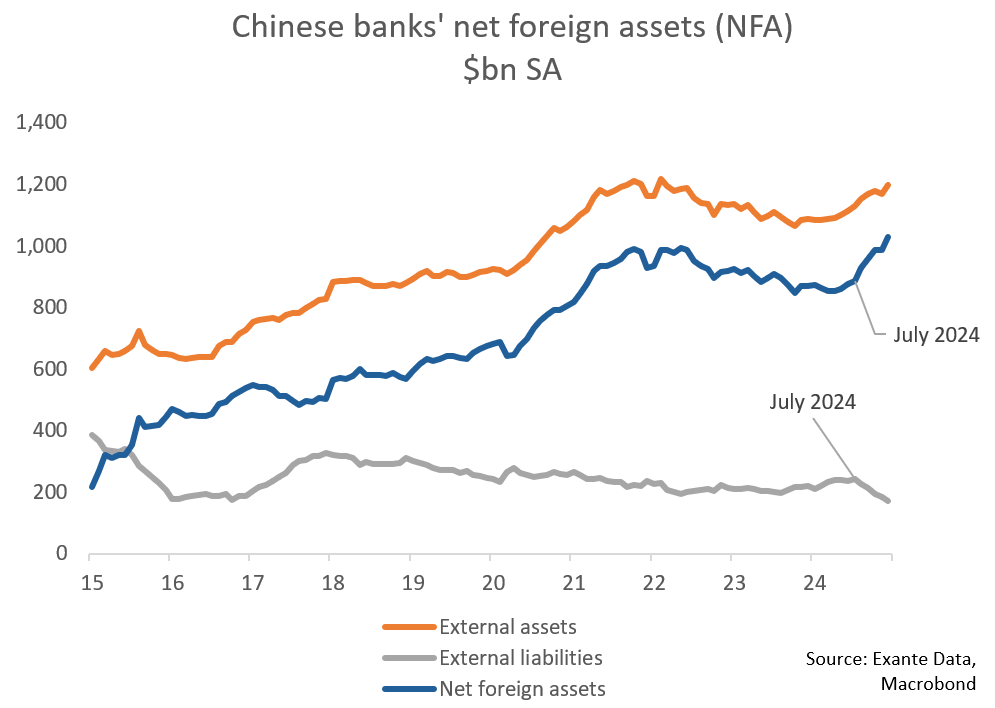
Why care? The amount of foreign assets (claims on foreigners) Chinese banks hold is huge in size: $1.2tn as of December. Liabilities to foreigners is much smaller at $166bn.
The below chart shows the data that has attracted attention recently: banks’ NFA increased by $65bn in December, the largest increase since January 2018 ($74bn). This means that Chinese banks increased their claims on foreigners by $65bn more than foreigners increased their claims on Chinese banks during December.
If we make two simple adjustments to the data, the latest datapoint is less extreme, however. The blue line in the below chart is first seasonally adjusted, after which we average January and February data to minimize distortions from Chinese Lunar New Year. On this basis the December datapoint is large indeed, but still broadly within the range seen in the second half of 2024.

A more interesting explanation for the recent large increases in banks’ NFA is that banks have been sourcing more of their FX onshore and less offshore. This explanation takes a few steps to explain.
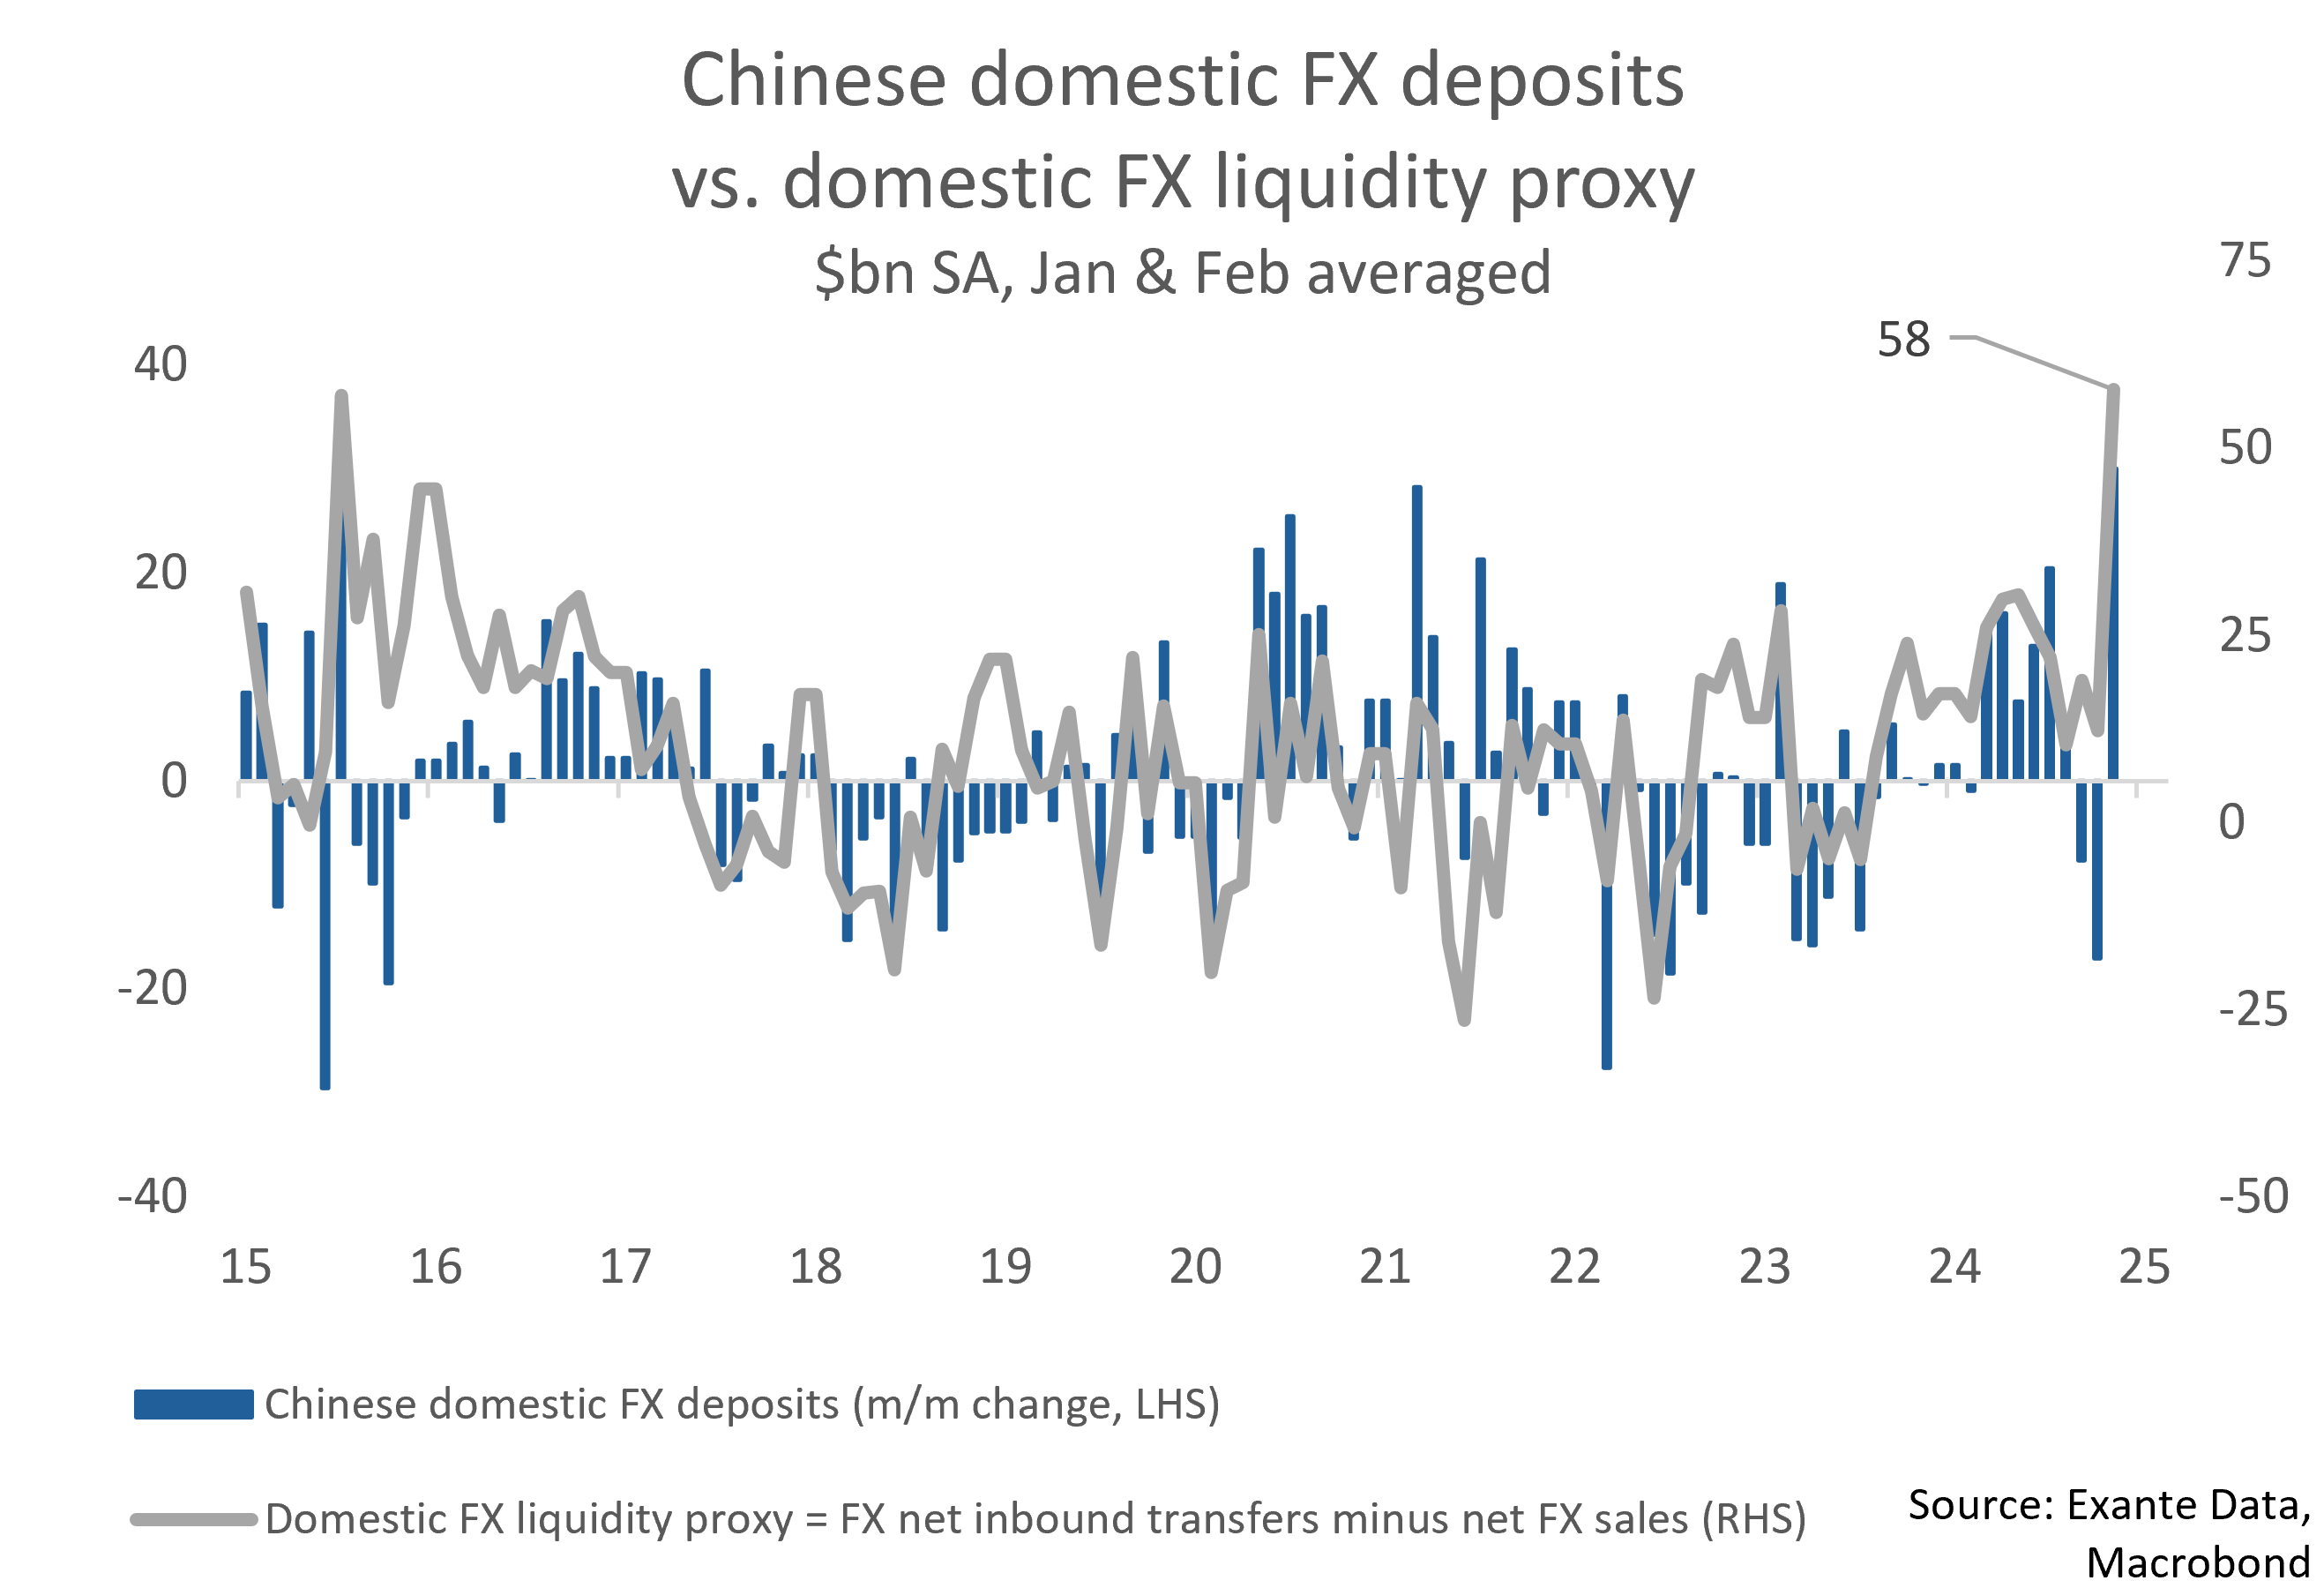
When companies transfer FX into China, they tend to convert it into renminbi (as this is the currency that is used in China!). This is what we show in the below chart, where the correlation (R2) between inbound FX transfers and FX sales is high (0.59). But in December, corporates remitted FX back to China ($15bn) and bought FX onshore ($17bn), a highly unusual combination.

As a result of companies both transferring FX into China on a net basis while also buying more FX from banks, there was a record-large ($58bn) increase in FX liquidity onshore in December (see below chart). The surge in FX liquidity, not surprisingly, has coincided with large increase in the amount of FX deposits within China. After all, there are few FX-denominated assets to invest in within China. (By FX liquidity we simply mean the sum of net inbound FX transfers and FX purchases from banks.)
The large increase in FX onshore liquidity likely prompted (or allowed) banks to source more of their FX funding onshore rather than offshore. One reason why banks would want to do that is that Chinese authorities’ intervention in FX markets make it cheaper to buy foreign exchange onshore than offshore (as intervention props up the value of the renminbi).
But, like we stated earlier, banks' NFA only include assets and liabilities vs. entities outside of China. This means that if banks borrow more FX (receive more FX deposits) onshore it would not affect external liabilities and, therefore, leave NFA unchanged.
Yet banks’ external liabilities also started to decline during summer 2024 and fell by $72bn between July and December. Though foreign liabilities have trended down ever so gradually in recent years, the decline in the second half of 2024 is unusual.
One interpretation is that the increase in domestic FX deposits allowed banks to reduce their reliance on external FX funding. (There has also been an increase in external assets, though that is less abnormal).
Despite the decline in external liabilities shown above, Chinese banks’ overseas FX deposits have only fallen by $2bn between July and December (see chart below). This means that the decline in external liabilities was driven by something else than overseas FX deposits. As such, banks probably used the increase in domestic FX deposits ($33bn increase during July-December, blue bar in below chart) to pay off other types of external liabilities.
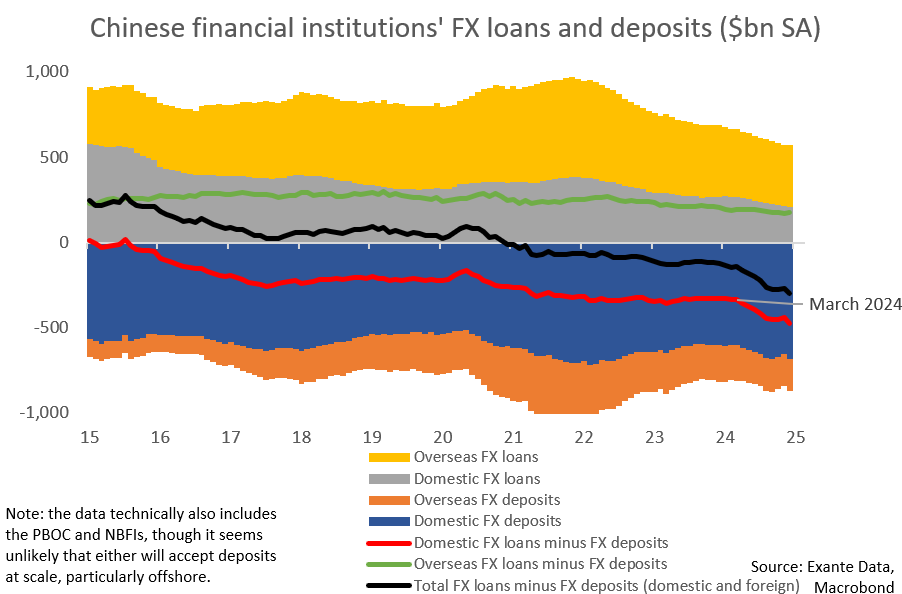
Taken together, it seems likely that banks have reduced the size, and changed the composition, of their external financing at least somewhat by paying off offshore non-deposit liabilities with onshore FX funding (including deposits).
It makes sense that banks would want to convert non-deposit offshore dollar funding (e.g. bonds and repos) into onshore FX deposits. The cost of (onshore) deposit is likely lower than that of other types of (offshore) funding and probably also more stable.
This means that the increase in Chinese banks’ NFA perhaps might be slightly less reflective of a “real” increase in their total (offshore and onshore) net FX holdings than the headline NFA data would suggest. As such, the data might therefore not contradict the notion that state banks have sold FX to defend the renminbi as it would appear at a first glance.
If Chinese companies increasingly park their dollars onshore it should, all else equal, make global (ex-China) FX liquidity tighter. As a result, demand for (mostly) USD-denominated assets should decline at the margin. Investors who hold dollars outside of China can, for example, use them to invest in US Treasuries, money market funds or stocks, whereas onshore there is little use for dollars besides from, for example, lending (swapping) them to state banks or simply depositing them.
The content in this piece is partly based on proprietary analysis that Exante Data does for institutional clients as part of its full macro strategy and flow analytics services. The content offered here differs significantly from Exante Data’s full service and is less technical as it aims to provide a more medium-term policy relevant perspective. The opinions and analytics expressed in this piece are those of the author alone and may not be those of Exante Data Inc. or Exante Advisors LLC. The content of this piece and the opinions expressed herein are independent of any work Exante Data Inc. or Exante Advisors LLC does and communicates to its clients.
Exante Advisors, LLC & Exante Data, Inc. Disclaimer
Exante Data delivers proprietary data and innovative analytics to investors globally. The vision of exante data is to improve markets strategy via new technologies. We provide reasoned answers to the most difficult markets questions, before the consensus.
This communication is provided for your informational purposes only. In making any investment decision, you must rely on your own examination of the securities and the terms of the offering. The contents of this communication does not constitute legal, tax, investment or other advice, or a recommendation to purchase or sell any particular security. Exante Advisors, LLC, Exante Data, Inc. and their affiliates (together, "Exante") do not warrant that information provided herein is correct, accurate, timely, error-free, or otherwise reliable. EXANTE HEREBY DISCLAIMS ANY WARRANTIES, EXPRESS OR IMPLIED.