
How to Manage the Dollar (Part II)
How strong is the dollar?


We previously noted the resurgence in concern about the “strong dollar” as the prospect of a Trump 2.0 administration comes into view.
But how strong exactly is the dollar today?
CPI-based REER
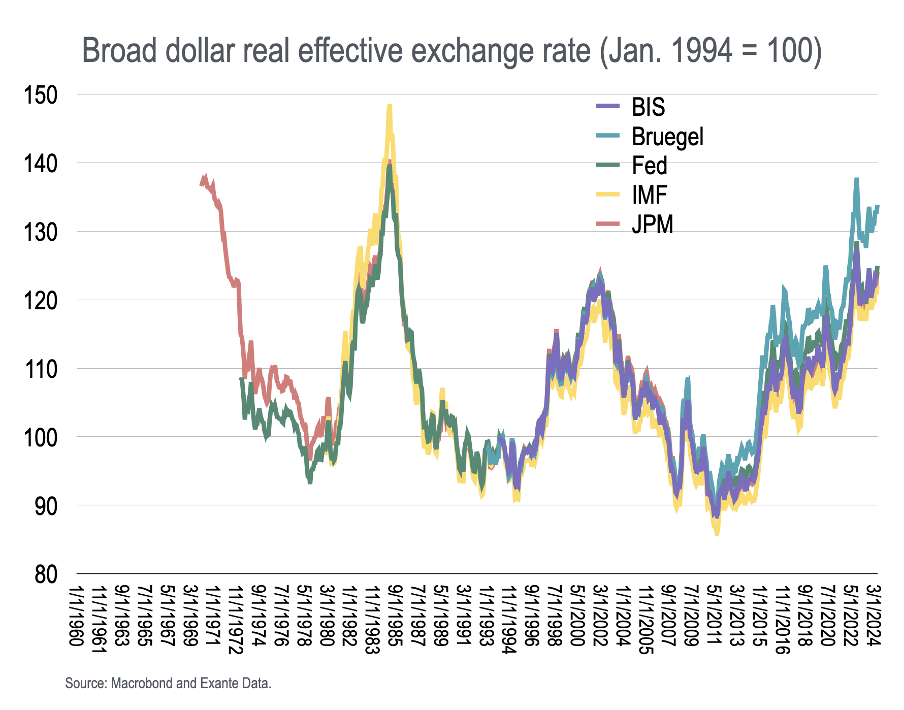
In broad CPI-based REER terms, the dollar is close to its 2002 peak when we use measures that stretch back to the 1970s (IMF, Fed, and JPM for example). But it is still below the mid-1980s extremes—a time when it was widely thought the dollar exchange rate was driven by a bubble, disconnected from fundamentals.
The picture is much more nuanced, however, when we look at bilateral exchange rates, and depends on the cross, time period and measure used.
In the below table, we look at the exchange rates between the US and its ten largest trading partners, across 1) ‘nominal’ and ‘real’ (CPI-based) bilateral exchange rates and 2) returns since 1999 and 2010.
USD has strengthened substantially against the JPY no matter which period or measure we use, though the magnitude differs substantially. But for other pairs, the takeaways vary substantially. The dollar has strengthened a lot against the MXN since both 1999 and 2010 on a ‘raw’ basis, but has barely moved when we account for inflation differentials. The opposite is true in Taiwan, where the nominal USDTWD has barely moved, though the dollar has strengthened on an inflation-adjusted basis.
The dollar has appreciated against EUR and GBP on a real basis, largely due to nominal exchange rate strength. Against CNY the appreciation is mostly due to inflation differentials as CNY has appreciated in nominal terms since 1999 (though not since 2010.)
The conclusion is that dollar strength depends on which ‘dollar’ you look at, and this may be important when you think about how to design dollar policy going forward (Trump specifically referred to JPY and CNY in his recent interview with Businessweek).

ULC-based real exchange rates
Standard REER-based indexes focus on relative consumer prices whereas “cost” measures could paint a different picture
The IMF produces a unit labor cost-based real exchange rate measure while JPM produce a PPI-based measure, both since 1990. And, in contrast to the CPI-based broad measure, both are at a peak in the post-1990s period (ignoring the pandemic-related exchange rate move.)
So on a cost-basis, the US real exchange rate is even stronger than implied by consumer prices, especially on a unit labour cost basis.
The IMF’s unit labor cost measure is 37% above the its average since 1990, the JPM PPI-based measure 22% and the Fed broad REER 18%.

Current account
Turning to the US current account, the external deficit today is about 3.3% of GDP which compares to the pre-pandemic steady state close to 2% of GDP though still below the 4.1% of GDP through early-2022.
The deficit today remains well below the 2006 peak, a lagged response to the previous REER peak in the early-2000s, though is close to the current account deficit in the mid-1980s.
Though the external deficit is below previous highs, the composition of the deficit has shifted towards non-commodity goods as the commodity deficit has disappeared since the US shale boom. In fact, relative to GDP, the US non-energy goods deficit is higher than the experience in the 2000s.

Bilateral balances
Another way to view the current account is to consider the bilateral balances produced by the BEA. Looking at the bilateral current account against China, Japan and the Eurozone, we see little movement against Japan and only a small movement against the Eurozone, while the US bilateral deficit with China has compressed from 2% of GDP over 2007 to 2018, about 1.5% of GDP from 2019-2022, and only about 1% of GDP over the last 12 months (though this does not take into account transshipment of goods via other countries).

The bilateral balances suggest the US deficit has in fact compressed.
If we instead decompose the US external deficit by major region, we see the Asia-Pacific deficit has been sticky despite the apparent bilateral shrinkage against China. In other words, the US deficit against Asia-Pacific is largely unchanged, as exports to the US shift from China to other players in the region.

Contribution of net exports to US growth
The chart below shows the rolling 5-year contribution of net exports to US real GDP growth (annualised) since 1970 as well as the Fed broad dollar REER (right scale). We see that periods of dollar strength is associated with a drag on real growth of between 0.5ppts and 0.7ppts per year in the 5-years leading up to the tropical dollar peak–meaning a cumulative drag on growth of 2.5-3.5ppts.
Of course, the unwind of dollar strength sees the contribution of net exports turn positive again as the external imbalance and REER over-valuation unwinds.

We should note the contribution of real imports and exports separately to this net growth contribution, as in the next chart. On a rolling 5-year basis, real exchange rate appreciations are followed by an increase in real import growth and slowdown in real exports.
The latest cycle appears to show a smaller expansion in imports and prolonged period of zero export growth. This still has sees a large current account impact as the stead state current account was 2% deficit this cycle compared with 0% current account balance in the late-1970s and early-1990s, from which the external cycle began (see above).

Conclusions
Overall, US dollar strength is comparable to the peak in the early 2000s, though the picture is nuanced. The bilateral RER against JPY is much stronger than at any time since the 1990s, other bilateral measures are much less extreme.
Meanwhile, cost-based measures of US REER, such as unit labour cost measures, are as strong as any time since the 1990s.
Despite this, the current account deficit at about 3.3% of GDP is substantially smaller than in the 2000s and comparable to the mid-1980s deficit (because rising energy production has countered a large goods trade deficit).
Meanwhile, the bilateral deficit against China has compressed in recent years, while the deficit with Asia-Pacific is still sticky–as exports to other Asia countries have increased.
We think it is important to note that there is not one dollar. Each cross has its own story, and it also matters whether you look at nominal FX rates, or various real metrics. The Yen stands clearly out on any FX metric as extremely cheap vs the USD. For the CNY, traditional FX indices look more boring, but the overall trade deficit to Asia points to a valuation issue still.
Part III of this series will ask what options are available to policymakers to weaken the dollar.
The content in this piece is partly based on proprietary analysis that Exante Data does for institutional clients as part of its full macro strategy and flow analytics services. The content offered here differs significantly from Exante Data’s full service and is less technical as it aims to provide a more medium-term policy relevant perspective. The opinions and analytics expressed in this piece are those of the author alone and may not be those of Exante Data Inc. or Exante Advisors LLC. The content of this piece and the opinions expressed herein are independent of any work Exante Data Inc. or Exante Advisors LLC does and communicates to its clients.
Exante Advisors, LLC & Exante Data, Inc. Disclaimer
Exante Data delivers proprietary data and innovative analytics to investors globally. The vision of exante data is to improve markets strategy via new technologies. We provide reasoned answers to the most difficult markets questions, before the consensus.
This communication is provided for your informational purposes only. In making any investment decision, you must rely on your own examination of the securities and the terms of the offering. The contents of this communication does not constitute legal, tax, investment or other advice, or a recommendation to purchase or sell any particular security. Exante Advisors, LLC, Exante Data, Inc. and their affiliates (together, "Exante") do not warrant that information provided herein is correct, accurate, timely, error-free, or otherwise reliable. EXANTE HEREBY DISCLAIMS ANY WARRANTIES, EXPRESS OR IMPLIED.
Thanks for this really Interesting and revealing analysis. I particularly agree with focussing on currency-pairs and also on bilateral CA balances / flows. That said, I have a broader question, which I hope you can address in Part III or a later post. My apologies upfront for this longish comment but my question basically is this: to what extent does any administration's dollar policy matter really in light of the fact that the US, being the issuer of the global reserve currency, is structurally bound to run a CA Deficit (CAD) ? To be sure, there is a view in International Economics / Econ History / International Political Economy that the issuer of a top international (reserve) currency does not really have to run a CAD. As you may already know, this "minority view" as it is known, was first advanced by Despres, Kindleberger and Salant (Despres, Emile, Charles P. Kindleberger, and Walter S. Salant (1966), The Dollar and World Liquidity: A Minority View (Washington, DC: Brookings Institution)), and which argues that a reserve currency issuer such as the US can simply supply global dollar liquidity via the Financial Account by essentially playing the role of a "banker to the world" (i.e., borrowing short (liabilities) and lending long (assets)). Sure, econ history (e.g., Barry Eichengreen) offers evidence for this as both the Pound Sterling and the US Dollar reached reserve currency status when the UK and the US were running a CA surplus. And, while those holding the minority view (such as Eichengreen and Benjamin Cohen) acknowledge that CADs followed in both, the case of the UK as well as the US, they don't see as a necessary condition for *sustaining* reserve currency status. The minority view is only partially correct In my opinion, for in order to sustain reserve currency status, the US for instance, has to run a persistent CAD. How else would the Rest of the World (RoW) "earn" dollars to payback (interest + principal) what is lent and/or invested long by the US via the Financial account? In short, as opposed to the minority view, both the CA and the FA are at work for a reserve currency issuer, with the CA having to be in a deficit for there to be demand in the global economy (that is a la Kindelberger the role of the hegemon after all). So, now coming back to my question, if the US has to run CA Defs, to what extent does any dollar policy matter? We may not be able to quantify it, but the way I see it, the US for sure cannot be a net exporter unless some other economy such as China become a net importer (highly unlikely at least as things stand).
Thanks again for your posts that I enjoy reading regularly.