


US fiscal sustainability once more
The outlook keeps getting worse

In 2022 we first noted how the fiscal outlook globally was changing under higher interest rates.
At that time, we set out a scenario where a structurally higher yield curve—with the 10Y US Treasury yield at 4%—would “feed into growing interest payments in coming years… [And] in contrast to the 1970s and 1980s, when high rates combined with a relatively low initial stock of public debt, high debt levels today bring fiscal risks… [whereby] interest payments [may] nearly triple in percent of GDP to absorb about one-fifth of Federal government tax receipts by the end of this decade.”
What was a scenario then is now a reasonable baseline.
Eighteen months ago, we further noted how “absent primary fiscal adjustment, for which there is limited political appetite at this time, and given where the yield curve has been recently, the government’s interest bill is set to rise sharply—so that the the overall fiscal deficit will remain elevated at between 6% and 7% of GDP throughout the decade.”
An update on the fiscal outlook seems in order with a focus on the yield curve assumptions embedded in today’s baseline.

CBO pre-reconciliation baseline
A useful place to begin is prior to the recent reconciliation discussions, to back out the implied yield curve assumptions in the Congressional Budget Office (CBO) baseline for US debt projections from their update in January.
And the interest assumptions are perhaps striking.
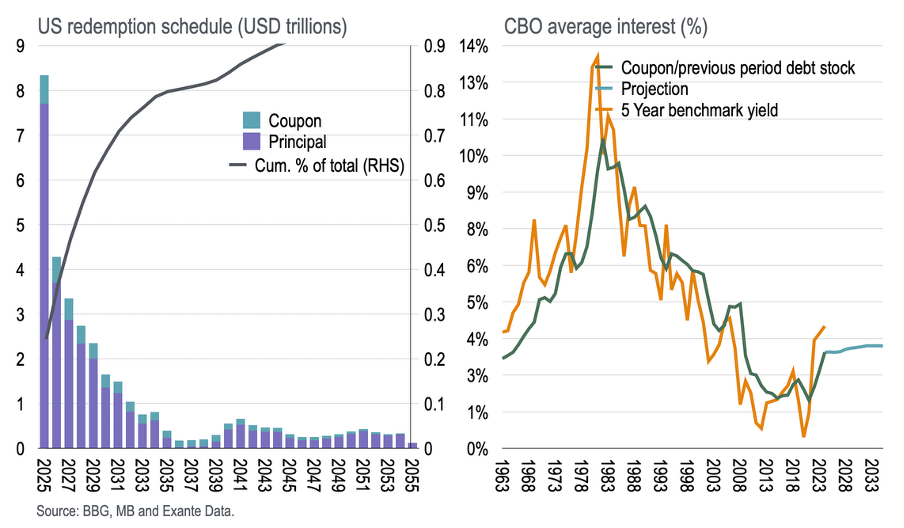
The chart below summarises, on the left, the redemption schedule for US Federal securities and coupons—of which, 50% will mature over the next 3 years and 70% by 2031. On the right is the CBO’s projected net interest payments divided by the previous period’s outstanding debt stock in the CBO’s January forecast update—as well as historical data set against the 5-year benchmark yield on US government debt.
Although the average interest paid is expected to increase, the delta from today is small and implicitly assumes a normalisation of the US yield curve relatively soon—supporting lower average coupons and therefore a more favourable deficit outlook.
Calibrating the CBO baseline
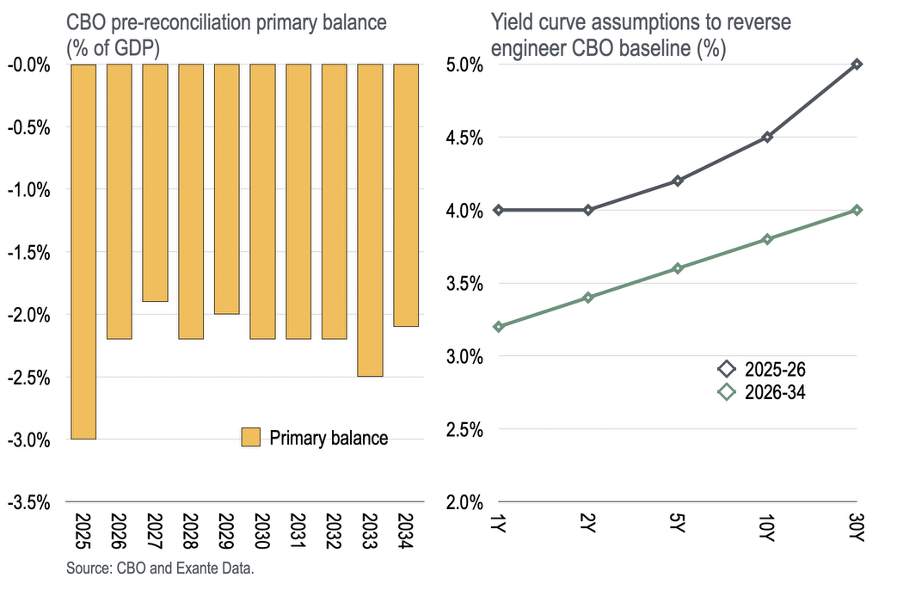
The next chart shows the CBO January baseline for the primary deficit and locks in two yield curves for constructing debt dynamics—assuming the yield curve remains around current levels in 2025 and 2026 before dropping to a lower level from 2027 onwards.
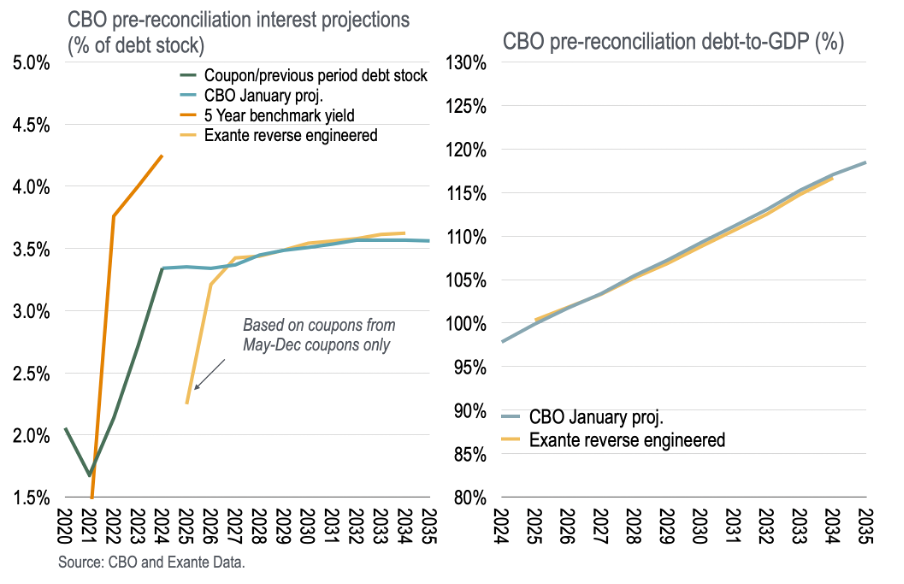
With these assumptions, including making use of the CBO’s nominal GDP path, we can reverse engineer a projection of interest paid (over the debt stock) and debt-to-GDP, as shown below.
With this, we recreate within touching distance the CBO baseline for public debt from January.
In other words: the CBO baseline assumes some interest rate normalisation.
Changing the baseline
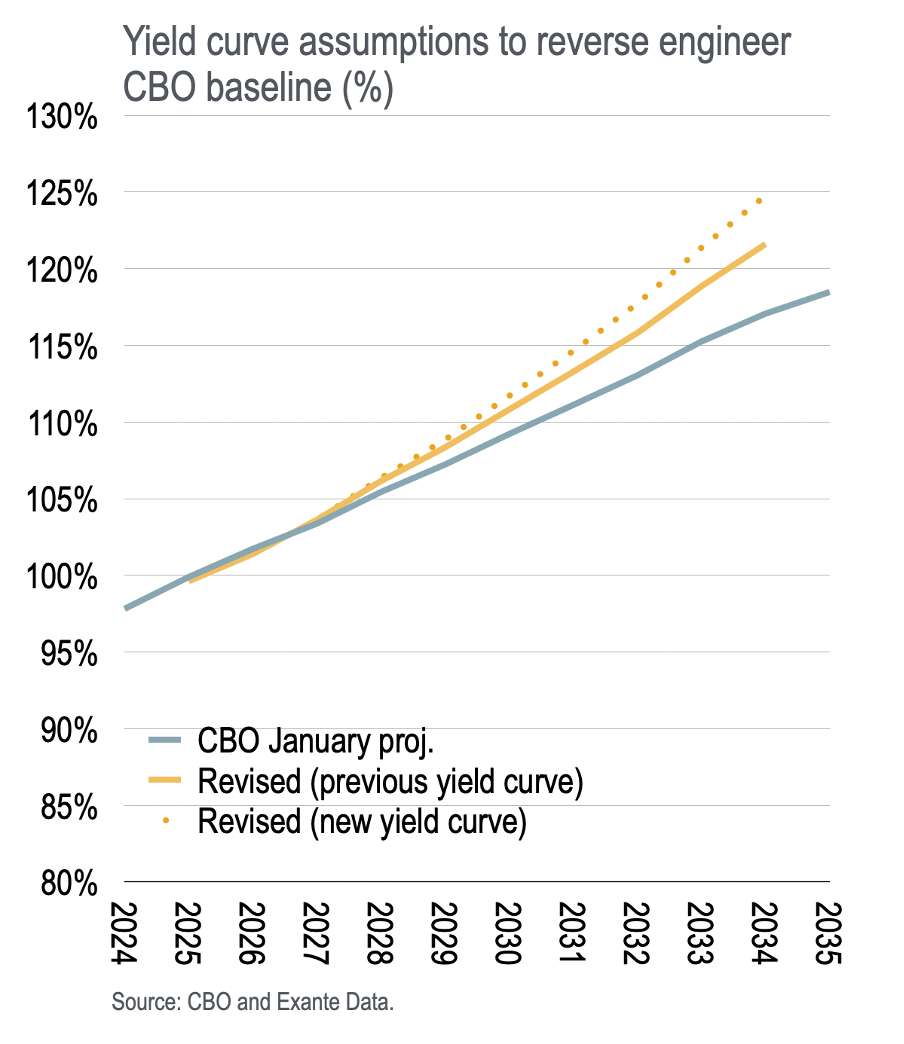
Further, we can consider what happens to debt-to-GDP under the recent reconciliation proposals given the previous yield curve assumptions. And we can modify this debt projection for the possibility that the yield curve, instead of normalising, remains at current levels.
Using the previous yield curve assumptions, debt-to-GDP is seen to be 1.6ppts of GDP higher in 2030 and 4.5ppts higher in 2034 as a result of the latest budget proposal.
But if a higher yield curve is embedded in this forecast—that is, assuming the yield curve remains at today’s levels—then debt-to-GDP is a further 0.9ppts of GDP higher in 2030 and 3.2ppts in 2034.
Of course, a further upward shift in the yield curve from here would further complicate matters.
In other words, instead of 117% of GDP in 2034 as in the January baseline, debt-to-GDP will be 122% holding the interest rate assumption constant or 125% if the yield curve remains elevated at current levels.
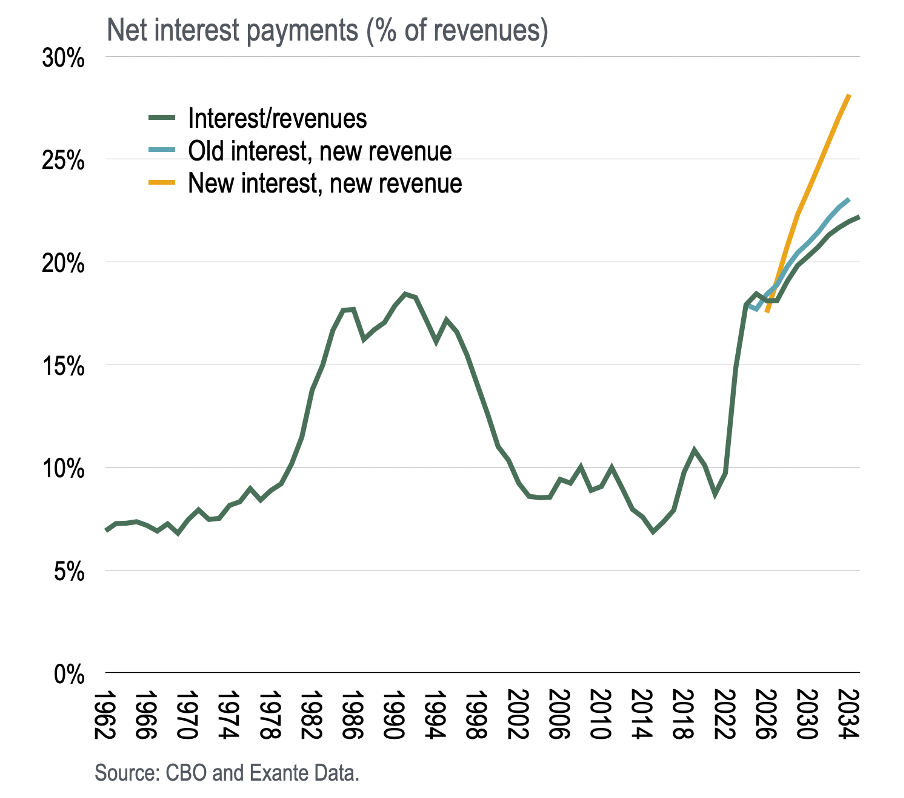
Interest payments-to-revenue
Returning to the theme of interest payments to Federal government tax revenues, recent budget proposals will push the United States into entirely uncharted territory—and potentially do so much quicker than previously expected.
In short, even with the yield curve assumptions implied in the CBO’s previous baseline, interest payments as a share of tax revenues were set to increase from 18% this year to about 22% by 2034. Reconciliation will lower projected tax revenues further, raising this ratio.
But if the yield curve settles at current levels, then interest-to-revenues will exceed 25% already by 2032 and will be on the way to 30% by 2025 on unchanged policy.
Conclusions
A crucial weakness here is the assumption that GDP is unchanged, given by the CBO projection in January. A period of dollar weakness will likely deliver higher inflation which will contribute to a lower debt-to-GDP and potentially deliver higher fiscal revenues. Likewise, AI could deliver productivity gains and stronger GDP growth. So in a sense, we ought to change the denominator in the debt-to-GDP and interest-to-revenues calculations also.
But this approach has the benefit of illuminating sensitivity to yield curve assumptions.
And we are entering territory never before experienced.
At least when Sterling lost status as the world’s reserve currency it was the gold standard constraint and its abandonment through which this loss was expressed.
In the post-Bretton Woods world, where the central currency is no longer linked to gold, the erosion of reserve currency status will have to find expression in some other way—including through inflation.
Perhaps the way this will be expressed is through growing interest obligations relative to revenue raising capacity of the government. Maybe this should be a key metric to watch, and whether investors demand ever-greater premia to continue to hold US duration assets.
Today we are on the precipice of the US facing the largest interest burden since at least the 1950s. Indeed, interest payments as a share of revenues are shortly going to exceed their peak in the late-1980s.
And if the yield curve truly remains at current levels, interest-to-revenues will exceed one-quarter already in 2032—and, in nominal terms, will double from projected USD1.0 trillion in 2026 to exceed USD2.1 trillion already in 2034.
The content in this piece is partly based on proprietary analysis that Exante Data does for institutional clients as part of its full macro strategy and flow analytics services. The content offered here differs significantly from Exante Data’s full service and is less technical as it aims to provide a more medium-term policy relevant perspective. The opinions and analytics expressed in this piece are those of the author alone and may not be those of Exante Data Inc. or Exante Advisors LLC. The content of this piece and the opinions expressed herein are independent of any work Exante Data Inc. or Exante Advisors LLC does and communicates to its clients.
Exante Advisors, LLC & Exante Data, Inc. Disclaimer
Exante Data delivers proprietary data and innovative analytics to investors globally. The vision of exante data is to improve markets strategy via new technologies. We provide reasoned answers to the most difficult markets questions, before the consensus.
This communication is provided for your informational purposes only. In making any investment decision, you must rely on your own examination of the securities and the terms of the offering. The contents of this communication does not constitute legal, tax, investment or other advice, or a recommendation to purchase or sell any particular security. Exante Advisors, LLC, Exante Data, Inc. and their affiliates (together, "Exante") do not warrant that information provided herein is correct, accurate, timely, error-free, or otherwise reliable. EXANTE HEREBY DISCLAIMS ANY WARRANTIES, EXPRESS OR IMPLIED.